Axels Pimped Apache Status


Description
The default apache status shows you information about current Apache
activity. But these server-status pages are difficult to read.
The Pimped Apache status makes the Apache server status readable,
sortable and searchable.
The webbased tool offers a multilanguage, skinable interface with a
built-in updater.
In several views you see most requested pages, vhosts, used methods,
IPs that make the most requests and more. All views are sortable
tables you can filter by a keyword and are available as API Request
too to get its data as CSV, XML or JSON.
With parsing the server status you see open or long running requests.
This tool is a live or realtime view - not a log analyzer.
It runs on PHP 8 up to PHP 8.5.
GNU GPL v 3.0
The project is hosted on Github: pimped-apache-status
Download
If you like that tool, you can support me and
Send a tip on Tipeee
... or donate on Paypal
Last Updates
- 2026-04-29: v2.04.17
- UPDATE: fixes for php 8.5 compatibility
- removed curl_close()
- removed: utf8encode()
- UPDATE: update phpdoc
- UPDATE: update web installer class
- UPDATE: update cdnorlocal class
- UPDATE: fixes for php 8.5 compatibility
- 2026-01-23: v2.04.16
- 2026-01-05: v2.04.15
- 2025-06-17: v2.04.14
- UPDATE: readme - remove compatibility to PHP 7
- UPDATE: cli class + bin/config.php: commented lines starting with semikolon are written to stderr now
- 2025-01-05: v2.04.13
- INFO: this (and former) version is compatible to PHP 8.4. This version runs on PHP 8 only.
- UPDATE: ahlogger class
- UPDATE: ahwebinstaller classes
- UPDATE: cdnorloacal classes
- UPDATE: font-awesome 6.4.0 -> 6.7.2
- UPDATE: jquery 3.6.4 -> 3.7.1
Features
- Show all or only active requests from server status page
- Top lists for most often processed requests, requested vhosts, methods, requesting ip addresses, slowest requests
- History data (saved in localstorage of your browser) help to estimate is it normal traffic or not
- All tables can be sorted and filtered
- Export any table (or automate it by API request) to CSV, JSON, XML
- Handles single servers and multiple servers as well (i.e. for loadbalanced website or project based view)
- Table view can be customized: make unneeded colums invisible;
- Web based interface in English and German
- Supports color schemes (using themes from AdminLTE)
- Integrated updater in the webinterface
- CLI for automated configuration setup with Ansible, Puppet & Co.
- Bookmarklet to beautify any server status page
Requirements
- On the system you want to install the pimped Apache status:
- any webserver with PHP 7 - up to 7.3 (it should run on PHP 5.3, but I don't support PHP5 installations)
- php-curl
- php-xml (optional; for xml exports)
- (btw: no database is needed)
- On all webservers you want to monitor:
- Apache 2.x
- installed module mod_status and ExtendedStatus On
- permission for the monitoring server to request the the alias /server-status
How does it work?
In the configuration you setup a list of apache servers. It can be
single servers or a group of servers in a loadbalanced environment.
The script requests all server-status pages of these servers simultanously
and parses the boring html output to an array.
As result you get different views of this array, like all current
requests, most requested urls or vhosts. You get several tables which
can be sorted (even multisorted) and filtered.
You easily can find long running requests or often requested pages.
You have a merged real time view about what all your webservers do.
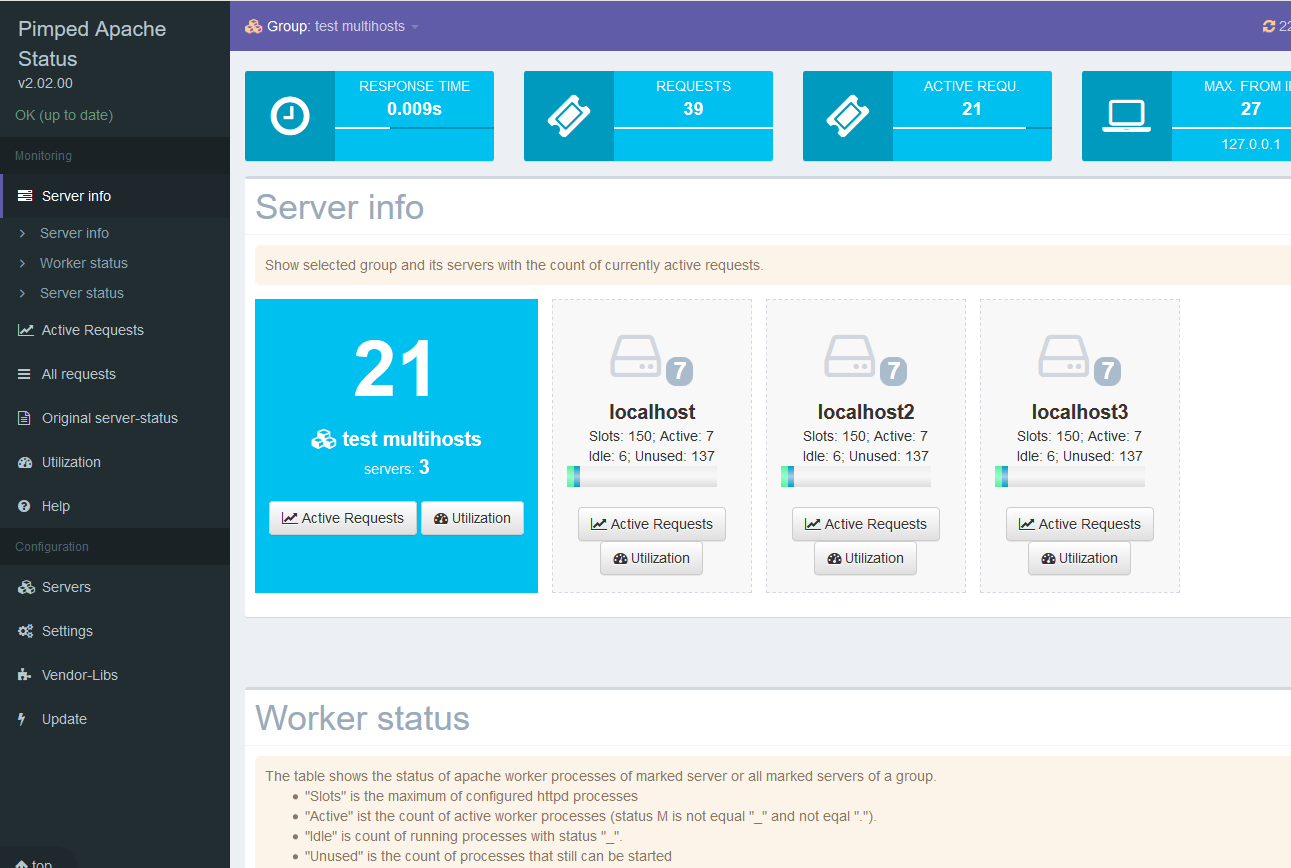
- You start a request to see any summary.
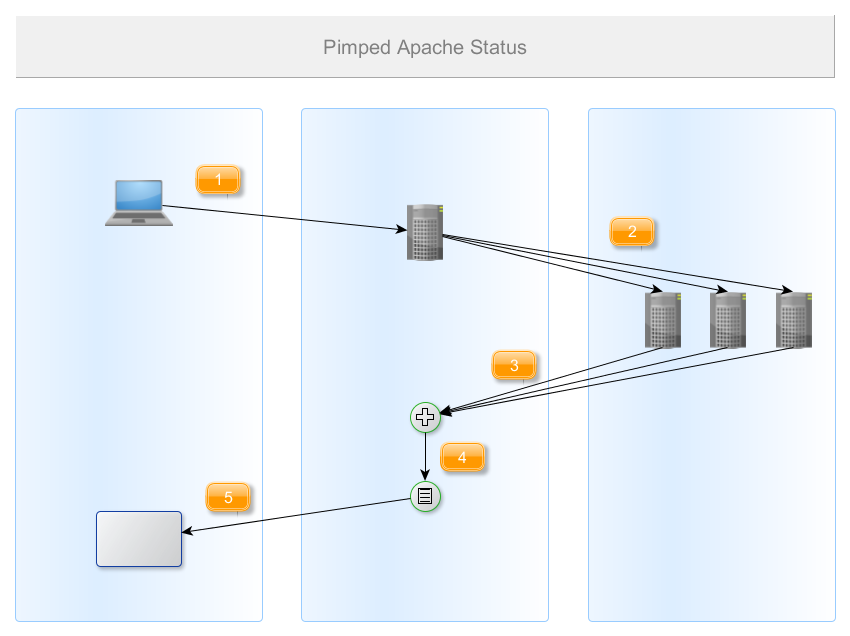
- The Pimped Apache status initiates a request for /server-status on all servers (it depends on your configuration and selection)
- ... and waits for the response of all servers
- ... to merge and filter the results
- ... and send it back to you in the wanted format
Screenshots
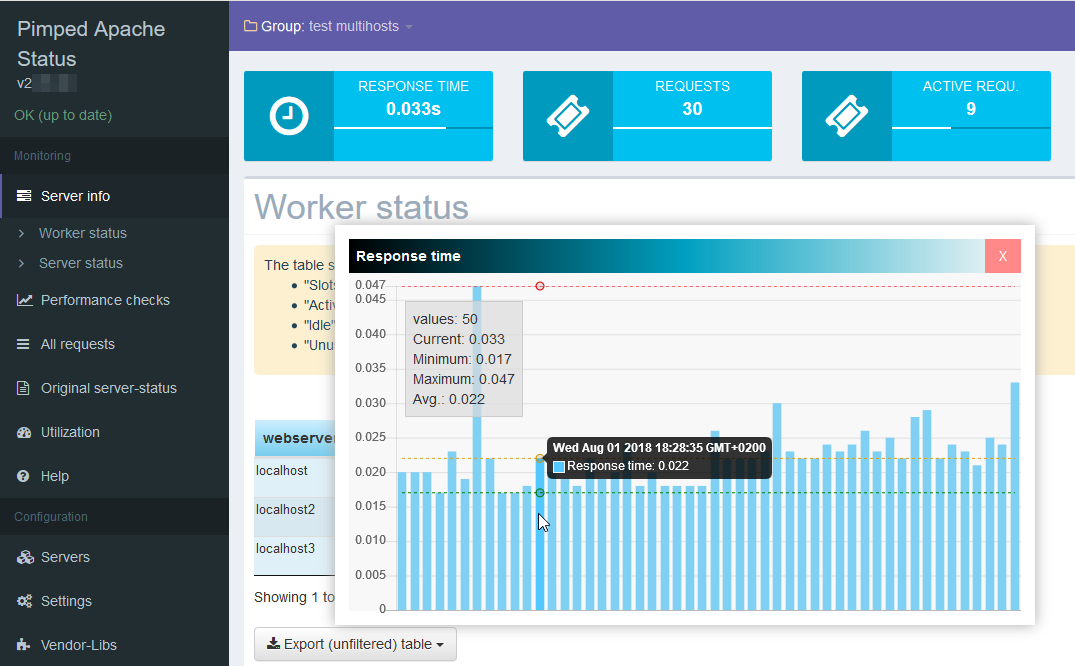
Tiles on top show a few relevant counters. On mouseover you get
a popup showing a graph with the last values in the past.
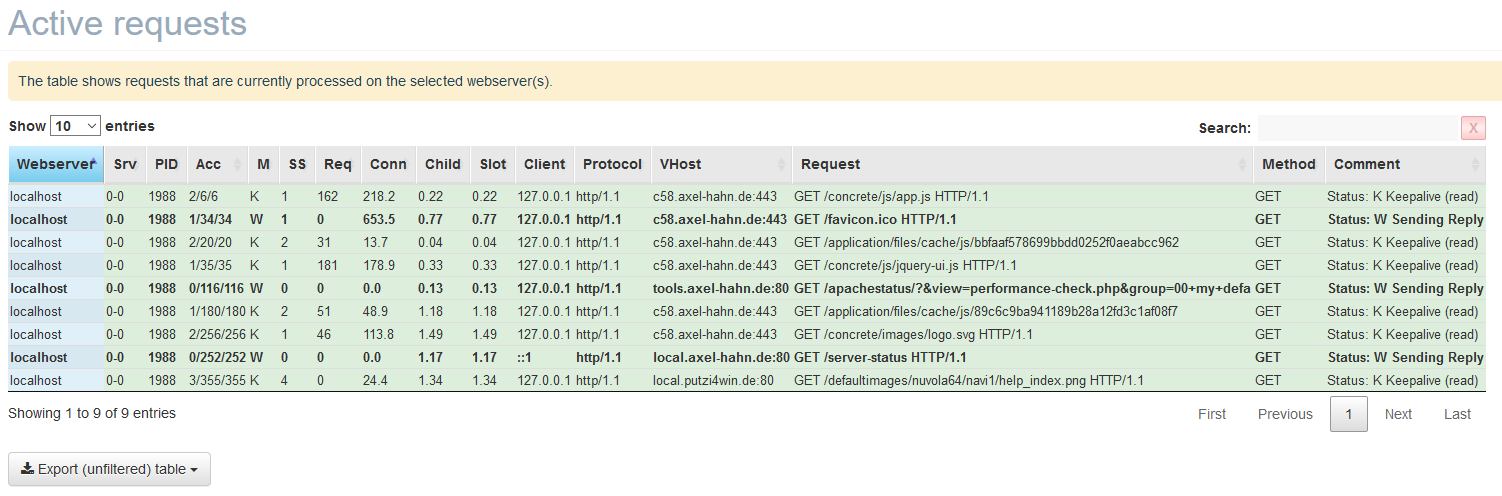
Active Requests in a table view. Each request is colored by type or
method. You can order the table by any column and multisort by
holding SHIFT key.
With a search field you can filter the current view.
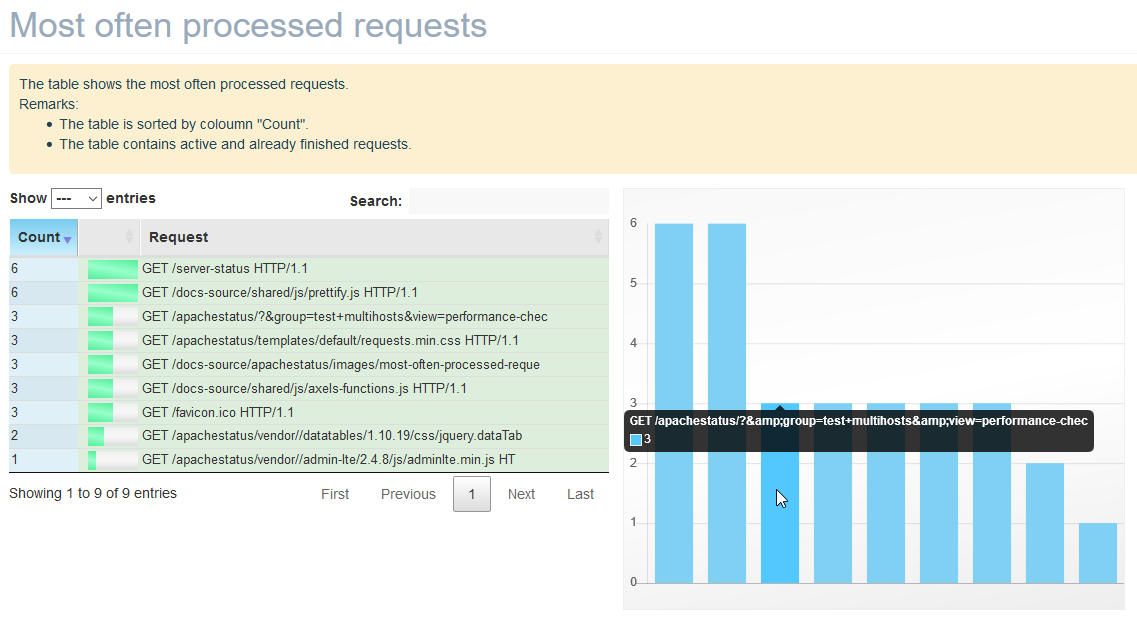
Most often processed Requests: does somebody attacks me with a
long running request?