Authentication
If you set a user and password then authentication is enabled and
you need to enter your credentials first.
After successful login you see a new log off button on the top right.

Server selection
With the server selection you influence what data from which server or servers will be analyzed.
Simple selections
On top you have a server selection:
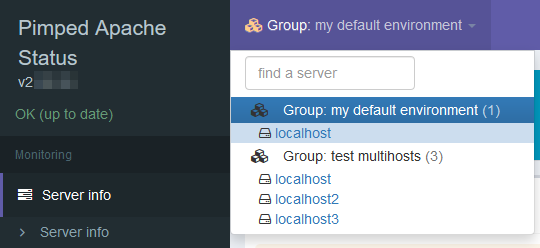
You can select ...
- a single server in a group to see the data of the selected server
- a group to get a merged view with all requests from all servers of a group. Use a group to see the analysis of a loadbalanced website.
Remark: if you have more than 25 servers then the server list
switches to a subfolder view.
Search for a server
If you have 5 or more servers in your config then you see a filter box. Type there
a few characters of a server to find. As result you see the all
server names that contain the filter text plus
the current server (highlighted).
Next to the search field is the count of found servers that match the filter.
Example:
In group "default environment" a server "localhost" is currently enabled.
If I type "2" it finds my testservers localhost 2 and localhost 12
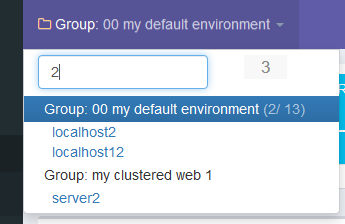
The filterted output shows:
- the "3" on te top right is the count of hits
- each group has a counter on the right, i.e. the group "multitest" has two hits of fiteen entries total
- the blue group and server is the currently activated system. It is always visible even if it does not match the filter
Tiles
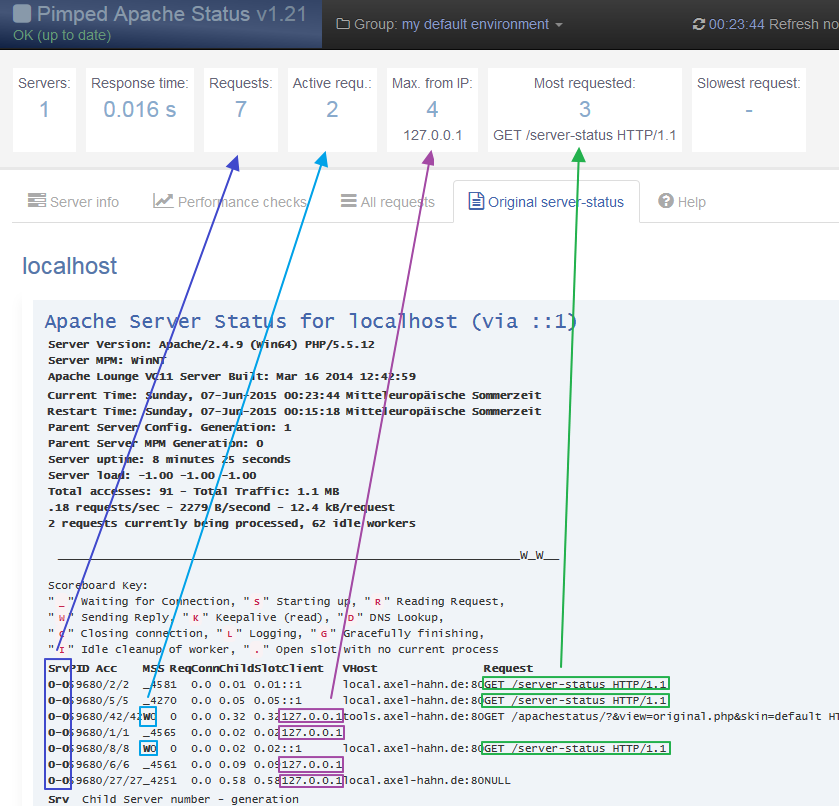
Explaination of values
On top you see the tiles. To explain what its sources are
I switched to the output of the original server status.
- blue arrow: count of requests = total amount of all (active and already finished) requests
- turquois arrow: active requests; it filters inactive requests with Mode of operation (column "M") "_" and "."
- violet arrow: most active ip
- green arrow: Most requested path; It is taken from all (active and already finished) requests; here it is NULL (3 counts)
- slowest request = slowest of (already finished) requests (the time is in coloumn "Req"); if there is a "-" (minus) sign it means: there is no request that is requested minimum 2 times.
History data in popup
All values you see in the tiles catches the browser and the last
[n] value will be stored in localstorage (= in your browser).
See Api
how to get data for any usage (monitoring, rrd graphs).
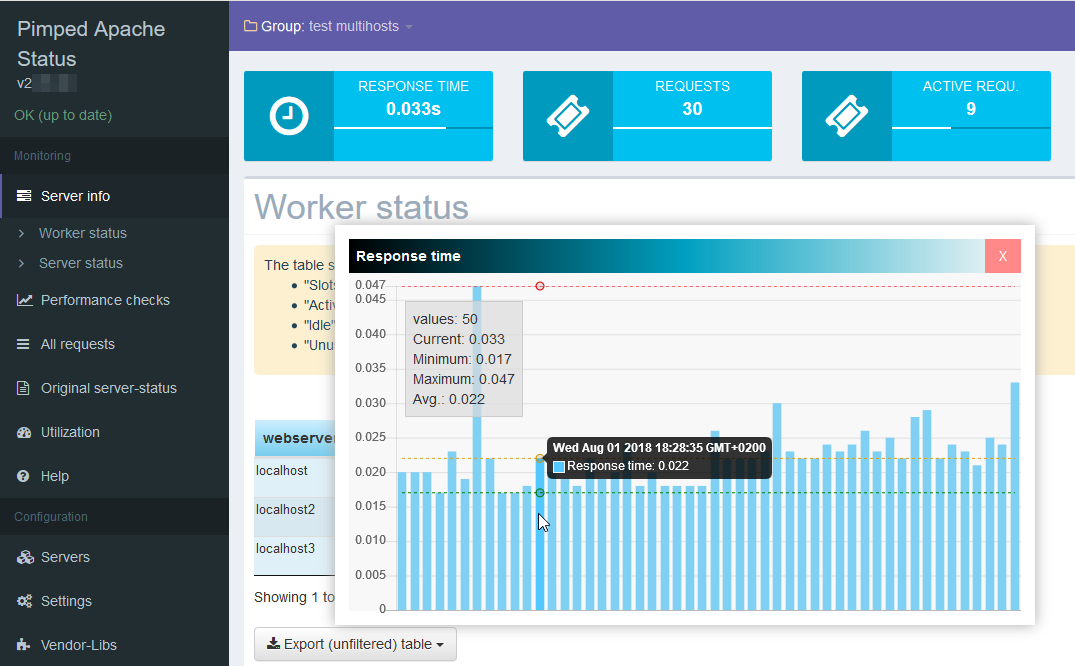
The Popup only appears if a few data were collected (not directly
after the installation) on mouseover on a tile.
The current item is the last on the right side (green). With the
horizontal line you have a camparison to other values.
The dotted red line shows the average value.
To keep the popup on screen *click* on a tile - a close button
will be visible.
Then the popup can be closed with pressing on the close button or with a
click on another tile.
As log the popup is sticky you can move the cursor over the bars
and see the value and time of the values in the past.
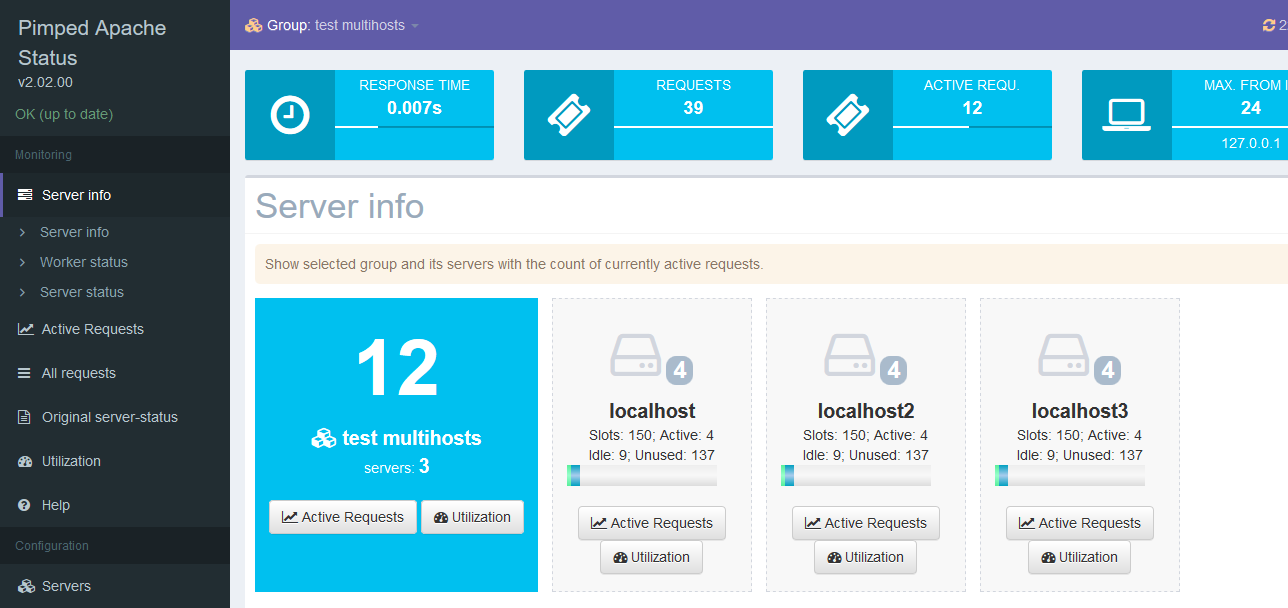
Server infos
Server info
You can define groups containing several servers. With that mechanism
you can group product specific servers or a st of loadbalanced systems.
If you selected a group in the first tile
you see the group and the count of its active requests of all its servers.
The next tiles show the workers available and used for each system in
the selected group.
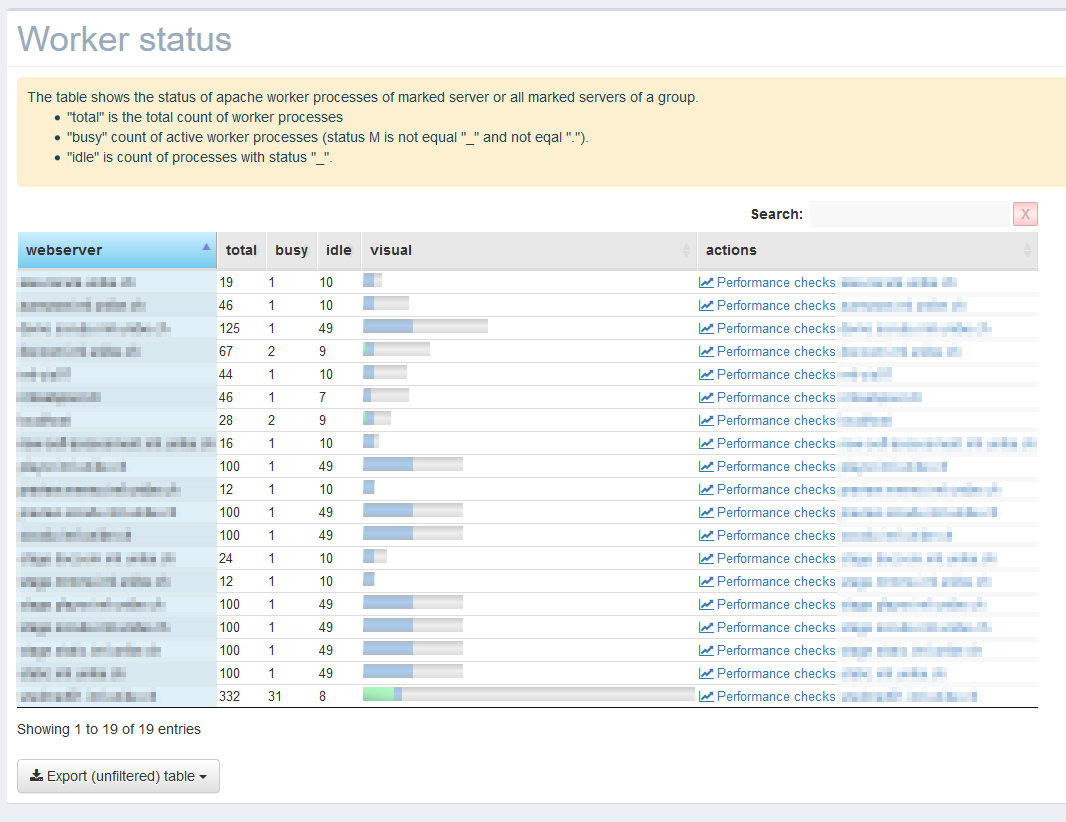
Worker status
The table shows the status of apache worker processes of marked server or all marked servers of a group.
- "total" is the total count of worker processes; the maximum is the max server setting in your apache config.
- "busy" count of active worker processes (status M is not equal "_" and not eqal ".");
- "idle" is count of processes with status "_".
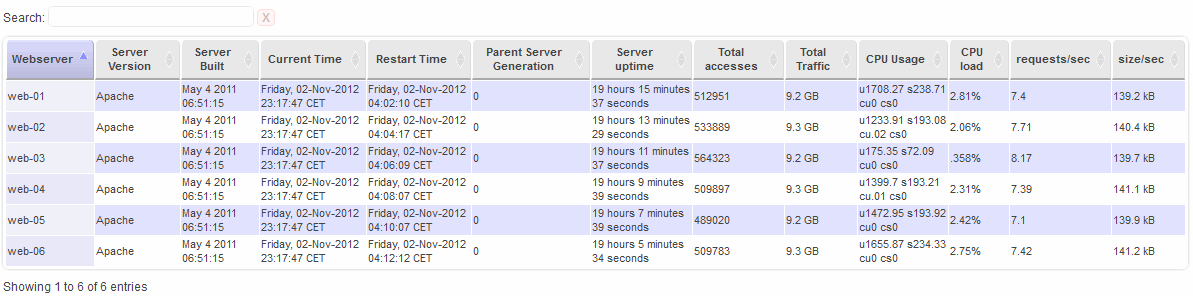
Server status
The table shows status information of the webserver(s)
You can sort the table by any coloumn by clicking the name in the
table head with the left mousebutton. Reverse order by clicking again.
Multi-coloumn sorting is available too: hold the
SHIFT key while clicking
in the table head.
Performance checks
Active requests
The table shows requests that are currently processed on the selected
webserver(s). It filters the inactive worker processes.
On the top left you can select how many entries you want to see;
on the bottom left is the paging.
The table shows these data which are available in the output of
the server-status request. It could differ from the apache version and
platform (Un*x/ Windows).
Additionally you have a comment coloumn that explains the type of the
request.
The color of the rows depend on the mode of operation (column "M").
Active requests are always green.
You can sort the table by any coloumn by clicking the name in the
table head with the left mousebutton. Reverse order by clicking again.
Multi-coloumn sorting is available too: hold the
SHIFT key while clicking
in the table head.
Use the search field to filter the table.
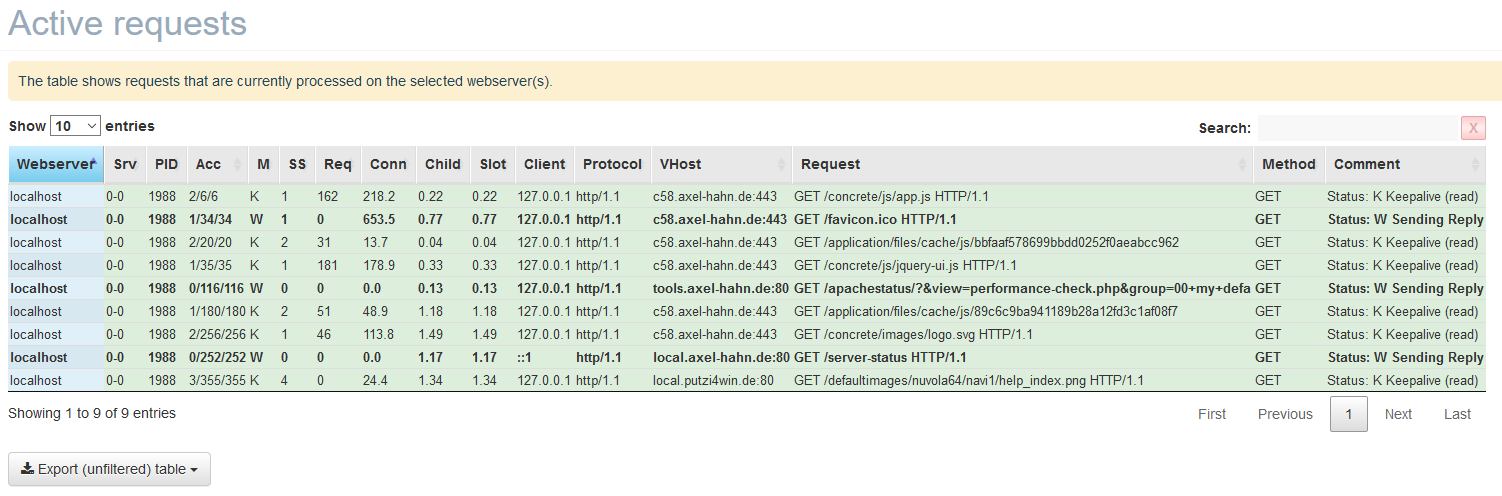
The most colums are the same like in the Apache server status page.
- Webserver name of the webserver (additional row)
- Srv Child Server number - generation
- PID OS process ID
- Acc Number of accesses this connection / this child / this slot
- M Mode of operation
- SS Seconds since beginning of most recent request
- Req Milliseconds required to process most recent request
- Conn Kilobytes transferred this connection
- Child Megabytes transferred this child
- Slot Total megabytes transferred this slot
- Client IP of the requesting client
- VHost processed vhost
- Request http method and request (maybe cut)
- Comment (additional row)
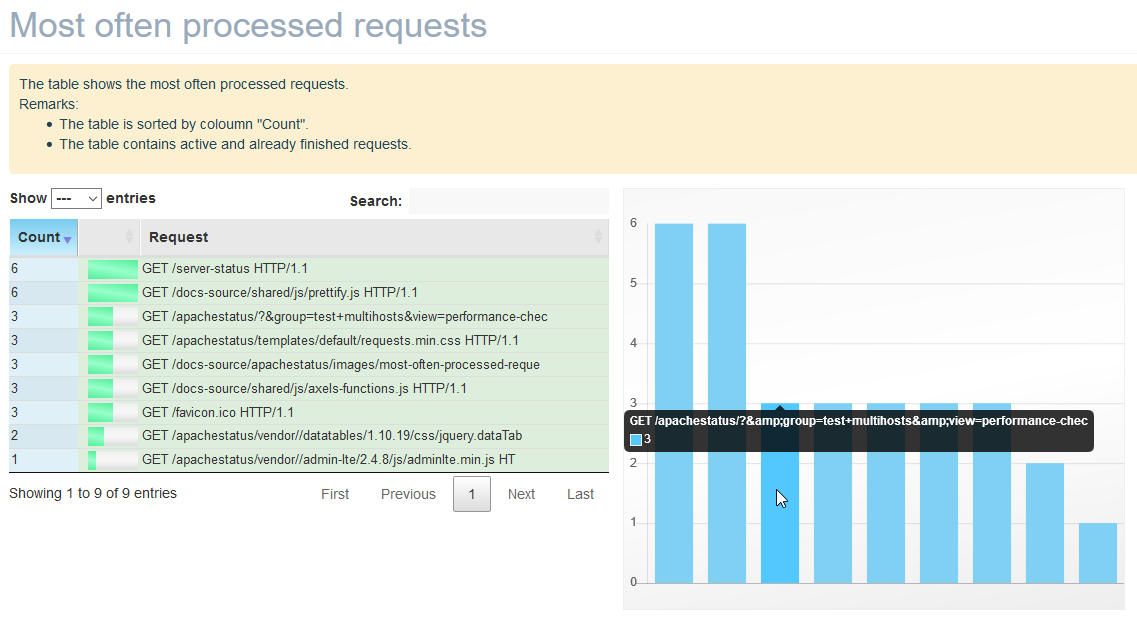
Most often processed requests
The table shows the most often processed requests.
Remarks:
- The table is sorted by coloumn "Count".
- The table contains active and already finished requests.
Here you could find out if somebody makes a DOS attack by requesting
a special long running request
Most often requested vhosts
The table shows the most often requested virtual hosts.
Remarks:
- The table is sorted by coloumn "Count".
- The table contains active and already finished requests.
Top 10 of slowest requests
The table shows all requests ordered by response time.
Remarks:
- The response time in the Apache status is available, if the request is finished. It is not available for currently procesed requests (its value is always "0").
- The table is ordered by columns "Req" (value is in ms)
All requests
The table shows all active and inactive requests of all selected
servers.
The color of the rows depend on the request type, mode of operation (column "M")
and exec time of a request.
HTTP method
- OPTIONS - light grey background; grey font
- HEAD - light blue background
- POST - green background
- PROP - light blue background
- GET - light green background
- PUT
- DELETE
- TRACE
mode of operation
- "S" Starting up - light green background
- "R" Reading Request - green background
- "W" Sending Reply - bold font
- "K" Keepalive (read)
- "D" DNS Lookup
- "C" Closing connection - light red background
- "L" Logging
- "G" Gracefully finishing - light red background
- "I" Idle cleanup of worker - light red background
- "_" Waiting for Connection - light grey background
- "." Open slot with no current process - grey background
exec time
- warning - exec time exceeds warning limit - red font; default is 1000 ms; you can override this in $aDefaultCfg["execTimeRequest"]["warning"]
- error - exec time exceeds critical limit - red and bold font; default is 5000 ms; you can override this in $aDefaultCfg["execTimeRequest"]["critical"]
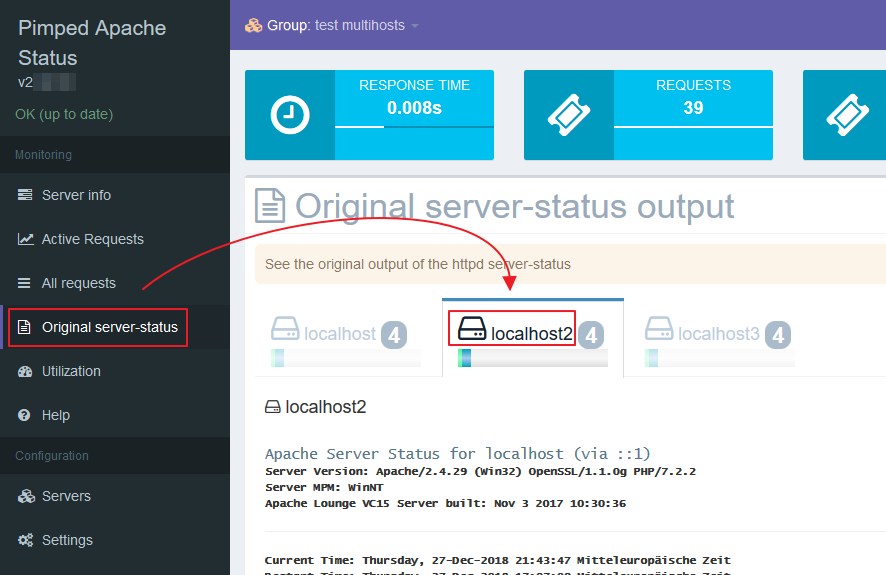
Original server-status
Here you can see the original server-status pages.
If you selected a group you get a tab list with each server.
Utilization
This page shows performance data of a single server. If you have a group of
servers then each server has its own tab.
First you get a few tiles with meta information in the header area of the
server status page.
- Version: shows the version information and used module.
- Running since: time since last start of the Apache httpd daemon
- Total accesses: count of accesses (incoming http requests) since last start of Apache httpd
- ms per request: average processing time to handle a request. This availability of this value depends on the used worker module - is absent for MPM worker.
- Total traffic: amount of transferred data to the clients as http response ... since last restart of the service.
- Slots: shows count of max. configured slots and ist current usage.
- Slots: max. configured slots (those can be processes [MPM worker] or threads [MPM event])
- Active: count of slots that currently handle a running request
- Idle: count of spare slots (it is a value between your configured MinSpare and MaxSpare value)
- Unused: count of slots that can be started. It is the difference between max. number of slots and currently Active+Idle slots.
There can be a warning box.
- If you configured a lot of slots but those are mostly unused. In a developer or testing environment you can ignore it. On a production system you should verify the count of your current max count of slots.
- If there are a lot of slots are currently in use you find a solution to increase the count of
available slots. If the max count of slots is reached then additional clients get an error message-box
that thir request was rejected. This reached limit is not logged in the apache access.log or error.log.
You can check if your current hardware constelleation is able to handle more requests ... depending on this the result can be ...- You need more resources to allow more slots
- You need an additional server behind a load balancer
- Developers/ Devops need to find a solution for better caching or a performance tuning of bottle necks.
Finally there is a graph visualizing the available slots (from config) and its current usage with idle and used slots (busy slots are active and idle slots).
Refresh time, skin, language
On the top right you have 3 selections:

Reload intervall
In the dropdown you can select how often the page will be reloaded.
The visible entries of this dropdown can be configured.
Skin
By default you see a selection of 12 skins. These come from AdminLTE.
The visible entries of this dropdown can be configured.
Language
By default you see a selection of 2 delivered languages:
"en" for english" and "de" for German.
The visible entries of this dropdown can be configured.
You can help me to translate the tool into your language.
Config :: Setup servers to monitor
Go to the configuration menu for servers.
All servers must be inside a group. Groups cannot be nested: there are
only groups on first level and servers to monitor inside.
Only one group or server can be changed at the same time
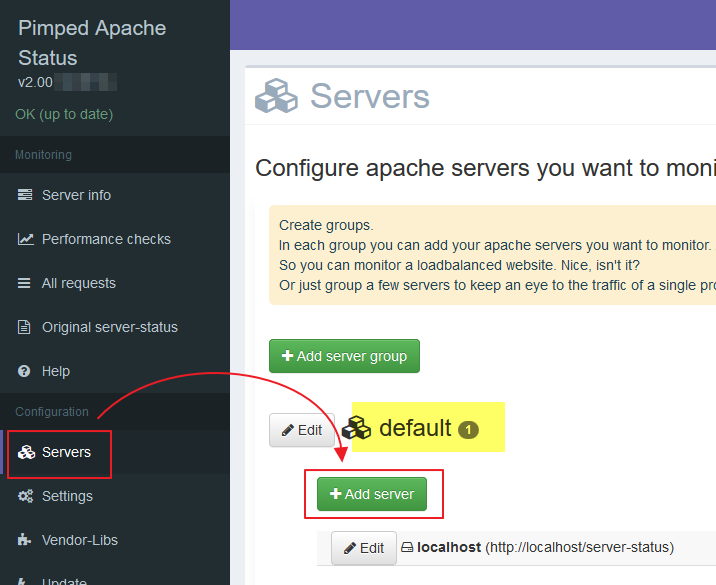
Setup groups
After installation there is a group "default".
You can add a new group. If you create (or rename) one, the groups are ordered alphabetically.
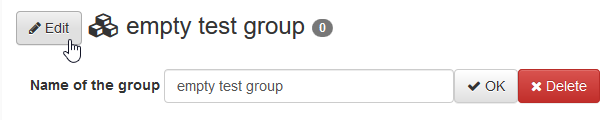
To modify or delete a group press edit button
To delete a group it must be empty (= containing no server). Only then the delete button is visible.
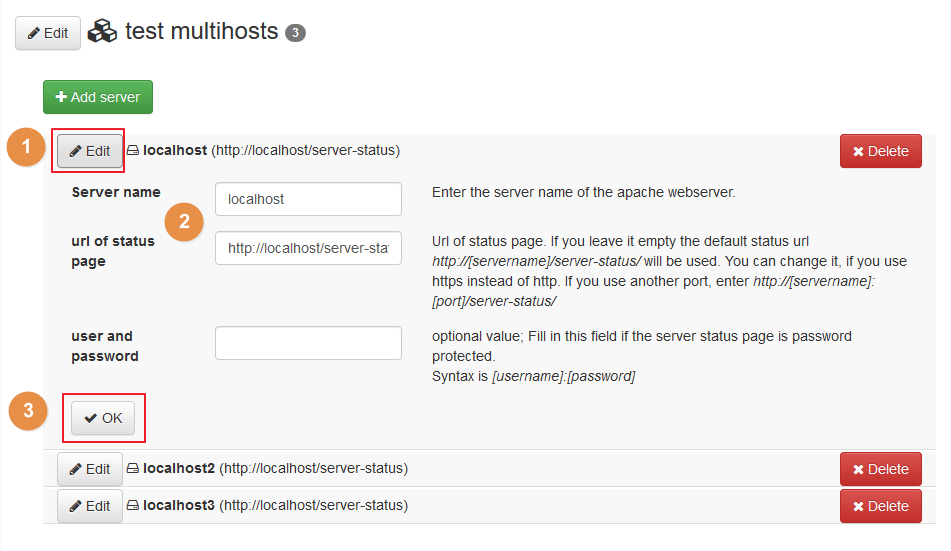
Setup servers
You can add a new server. If you create (or rename) one, the
server are ordered alphabetically inside the group. Additionally the
changed group
- Server name - the server name of the apache webserver. It is just a label
- Url of status page. If you leave it empty the default status url http://[servername]/server-status/ will be used. You can change it, if you use https instead of http. If you use another port, enter http://[servername]:[port]/server-status/
- optional: user and password - Fill in this field if the server status page is password protected. Syntax is [username]:[password]
To edit an existing server
- press [edit] to show edit form (pressing it again will hide the form).
- change settings.
- press OK.
Remark:
You can save only one host. Editing multiple hosts is not supported.
Config :: Settings
Text editor
In the settings you can override all default settings. It is more a raw editor
than a user friendly cutomization of all available settings.
See Customization
for a description of all values.
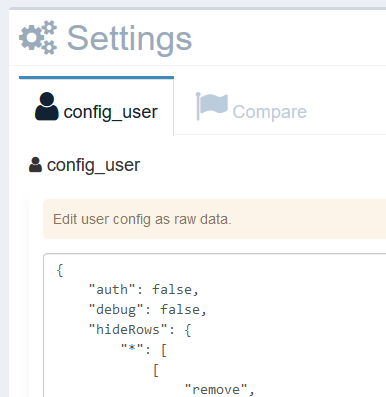
In the first tab enter your values to override.
The settings must have a valid JSON syntax. The key must be written with surrounding quotes (").
In the second tab is a comparison with all existing defaults.
{
	"[key1]": [value 1],
	"[key2]": [value 2]
}
If you press [OK] to save custom values a check will verify for a
valid JSON syntax. If it is not valid then it does not save the new config.
This prevents you to destroy a running config.
Additionally you get an info if a config key is invalid (and is useless).
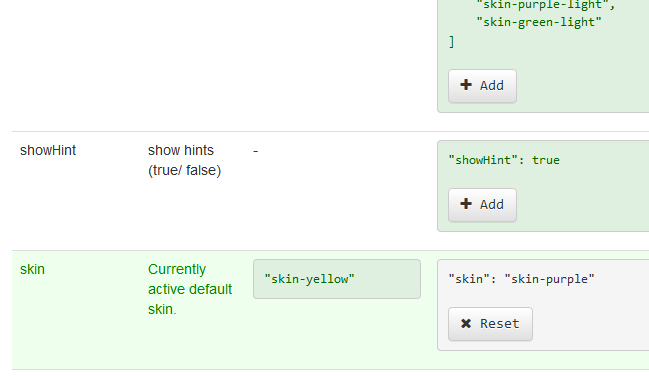
Compare
In the compare tab you see a description of all available settings and
its default values and highlighted user overrides.
Additionally here are 2 helper buttons.
Add entry to user config
With a button [+ Add] you can add a key that was not overridden yet.
This will add this key to the user config using the defaults and saves a new config.
In the Text editor of he first tab you can change the values.
Restore: remove entry from user config
On existing user values there is a button [x Reset] that removes this
entry from your config.
Config :: Vendor-Libs
The web frontend uses external libraries to save download space.
Using remote or local libs has no functional impact.
You can download the libaries to increase the speed of this web app and/ or to run it without additional internet access.
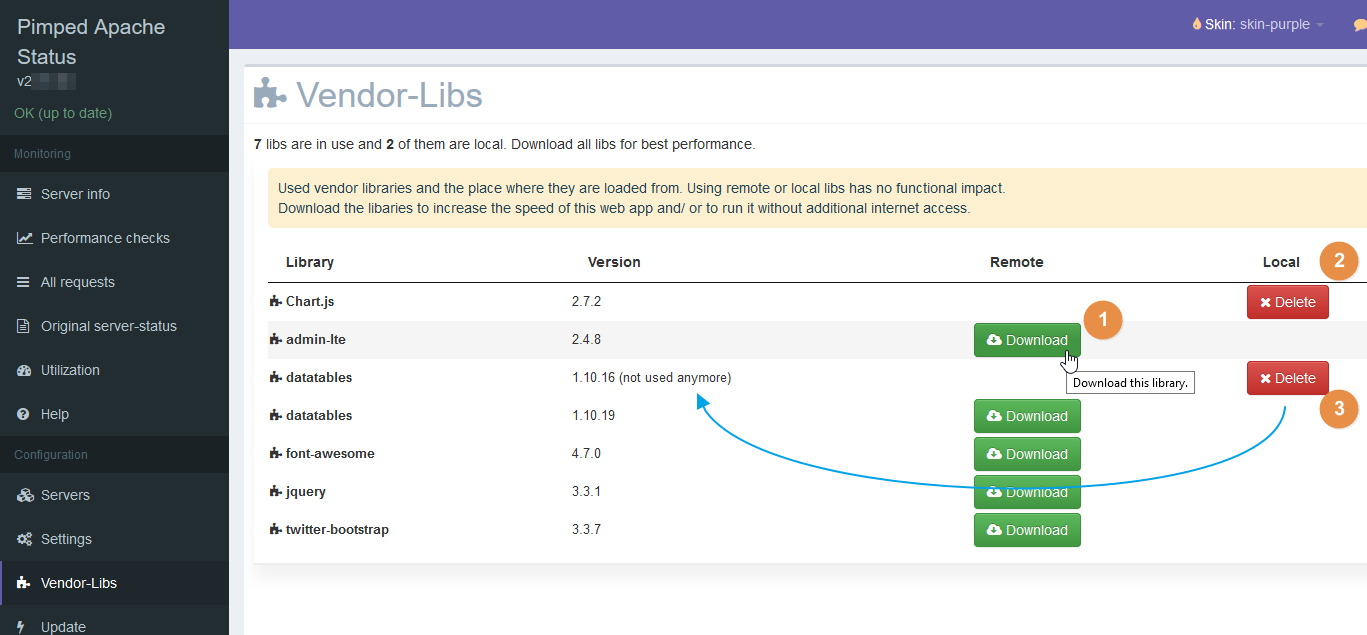
This page for vendor libs has these functionalities:
- You can download a library to your local installation directory. The target is ./vendor/[name-of-library]/[version]/
- If you downloaded a library you can delete it. If you do so then the download button will appear again.
- An outdated version or unused library (that locally exists) can be deleted.
In the screenshot above is the library datatables - there is a local version 1.10.16 - but the current version uses a newer datatables version. The unused version is marked with (not used anymore) and has a Delete button.