Table of Contents
Page: Html checks
Overview
The html checks detect several behaviours in the html content of all your websites.
Various values are relevant for SEO optimization. These information are based on simple counts and not its content quality but give a first orientation. The limit values can be refined in the program settings.
The tiles show …
-
indexed
Total count of fully indexed html pages. It is the content in the search index. -
crawl errors Count of crawler errors. If it is <> zero then you know that the search index is not complete.
-
too short titles
Count of too short title metatag values based on the given count of chars. -
too short descriptions
Count of too short description metatag values based on the given count of chars. -
too short keywords
Count of too short keyword metatag values based on the given count of chars. -
too long loading pages
Count of pages that load longer than a given limit. Remark: Slow pages are ratet worse by search engines. -
large pages
Count of pages that are larger than a given limit. Remark: this is just information and has no direct relevance for SEO.
All clickable tiles have a different look. A click on one jumps to a page section with more details.
Metadata
There are 3 sections for checks of html metadata
- Too short titles in meta tags
- Too short description in meta tags
- Not enough keywords in the meta tags
(1) These consist of a warning counter again. If there are empty data (next to the items smaller than the given limit) the count of empty values will be visible as error.
(2) A pie chart visualizes the relevance of the warning counts in comparison to the count of all pages.
(3) A table lists all urls with the troublemakers. Non Metadata
Then there are 2 more sections checking that are not based on any metadata or content.
- Long loading pages
- Large pages
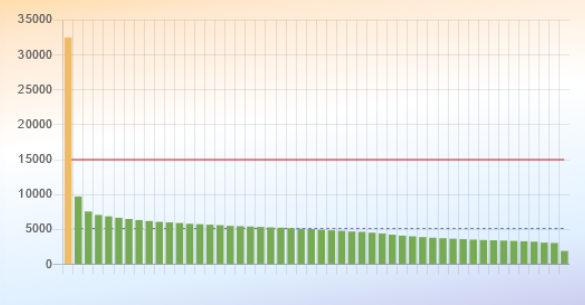
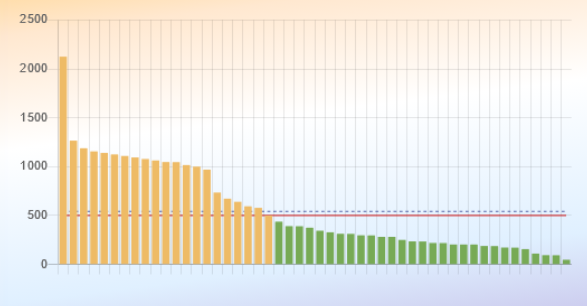
You have a counter and a pie chart again. Additionally here is an additional chart where you see the size (or loading time) of all your pages of a website. The graph visualizes the given maximum in comparison with existing values of your pages. An additional line shows the average of all pages value. This is a tool to estimate if there is a general problem or are there only a few troublemakers (or is everything fine).

